Create Charts with ECharts on Server Side Using WebBuilder
ECharts is a powerful JavaScript-based data visualization library that provides intuitive, interactive, and customizable charts. Running JavaScript on the server side is widely used in real applications — for example, querying data from a database, generating charts, and sending them directly to specified recipients via email. WebBuilder’s server environment supports multiple languages including Java, JS, Python, and R, making it easy to call the ECharts JavaScript library to generate charts.
Load echarts.js
In WebBuilder's ServerScript, you can load the echarts.js library using the Wb.load API method, then use ECharts to create charts.
Wb.load('wb/libs/echarts.js');
Create Chart
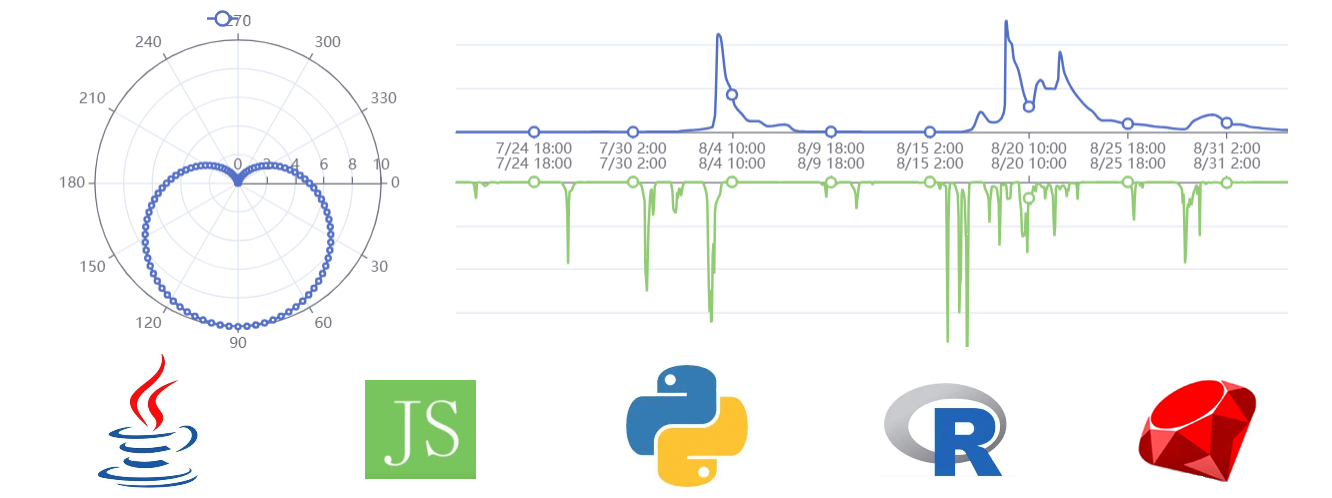
Use ECharts API to generate an SVG chart. Below is the complete code:
let i, theta, r, chart,chartSvg, data = [];

Wb.load('wb/libs/echarts.js');
//Please remove the theme when only used in the serverside
chart = echarts.init(null, Wb.get('sys.theme') == 'dark' ? 'dark' : null, {
  renderer: 'svg',
  locale: Str.lang == 'zh-cn' ? 'ZH' : 'EN',
  ssr: true,
  width: 500,
  height: 400
});
for (i = 0; i <= 100; i++) {
  theta = (i / 100) * 360;
  r = 5 * (1 + Math.sin((theta / 180) * Math.PI));
  data.push([r, theta]);
}
chart.setOption({
  title: {
    text: 'Server render'
  },
  legend: {
    data: ['line']
  },
  polar: {},
  tooltip: {
    trigger: 'axis',
    axisPointer: {
      type: 'cross'
    }
  },
  angleAxis: {
    type: 'value',
    startAngle: 0
  },
  radiusAxis: {},
  series: [
    {
      coordinateSystem: 'polar',
      name: 'line',
      type: 'line',
      data: data
    }
  ]
});
chartSvg = chart.renderToSVGString();
Result
Contact Us
Address: No.89 North Xisanhuan Road, Beijing, China
Email: contact@geejing.com
Website: https://www.geejing.com
Service Hours: Monday to Friday, 9:00 – 18:00
Contact Dedicated
Consultant
Copyright Notice
© All Rights Reserved, Geejing Technology Co., Ltd.
Enterprise Application Development & Runtime Platform WebBuilder
WeChat
